- Afhalen na 1 uur in een winkel met voorraad
- Gratis thuislevering in België vanaf € 30
- Ruim aanbod met 7 miljoen producten
- Afhalen na 1 uur in een winkel met voorraad
- Gratis thuislevering in België vanaf € 30
- Ruim aanbod met 7 miljoen producten
Omschrijving
Praise for the First Edition
"The main strength of this book is that it provides a unified framework of graphical tools for data analysis, especially for univariate and low-dimensional multivariate data. In addition, it is clearly written in plain language and the inclusion of R code is particularly useful to assist readers' understanding of the graphical techniques discussed in the book. ... It not only summarises graphical techniques, but it also serves as a practical reference for researchers and graduate students with an interest in data display." -Han Lin Shang, Journal of Applied Statistics
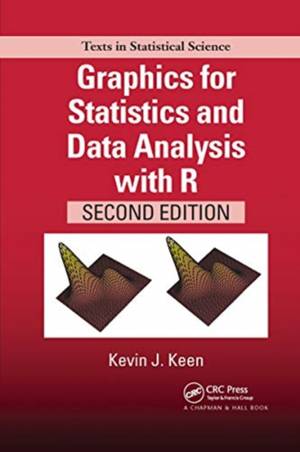
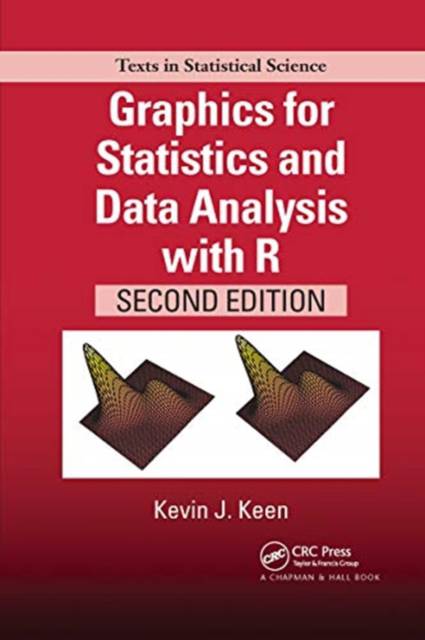
Graphics for Statistics and Data Analysis with R, Second Edition, presents the basic principles of graphical design and applies these principles to engaging examples using the graphics and lattice packages in R. It offers a wide array of modern graphical displays for data visualization and representation. Added in the second edition are coverage of the ggplot2 graphics package, material on human visualization and color rendering in R, on screen, and in print.
Features
- Emphasizes the fundamentals of statistical graphics and best practice guidelines for producing and choosing among graphical displays in R
- Presents technical details on topics such as: the estimation of quantiles, nonparametric and parametric density estimation; diagnostic plots for the simple linear regression model; polynomial regression, splines, and locally weighted polynomial regression for producing a smooth curve; Trellis graphics for multivariate data
- Provides downloadable R code and data for figures at www.graphicsforstatistics.com
Kevin J. Keen is a Professor of Mathematics and Statistics at the University of Northern British Columbia (Prince George, Canada) and an Accredited Professional StatisticianTM by the Statistical Society of Canada and the American Statistical Association.
Specificaties
Betrokkenen
- Auteur(s):
- Uitgeverij:
Inhoud
- Aantal bladzijden:
- 612
- Taal:
- Engels
- Reeks:
Eigenschappen
- Productcode (EAN):
- 9780367734442
- Verschijningsdatum:
- 18/12/2020
- Uitvoering:
- Paperback
- Bestandsformaat:
- Trade paperback (VS)
- Afmetingen:
- 155 mm x 231 mm
- Gewicht:
- 1197 g

Alleen bij Standaard Boekhandel
Beoordelingen
We publiceren alleen reviews die voldoen aan de voorwaarden voor reviews. Bekijk onze voorwaarden voor reviews.


