- Afhalen na 1 uur in een winkel met voorraad
- Gratis thuislevering in België vanaf € 30
- Ruim aanbod met 7 miljoen producten
- Afhalen na 1 uur in een winkel met voorraad
- Gratis thuislevering in België vanaf € 30
- Ruim aanbod met 7 miljoen producten
Zoeken
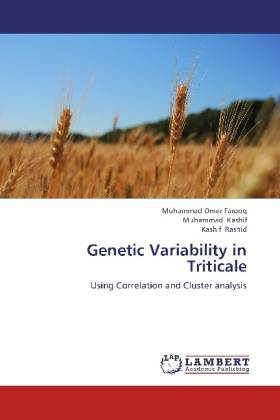
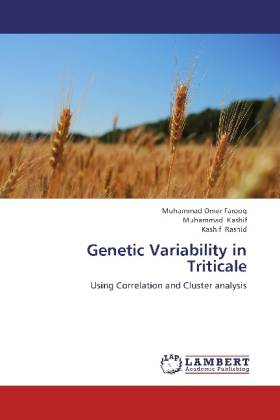
Genetic Variability in Triticale
Using Correlation and Cluster analysis
Muhammad Omer Farooq, Muhammad Kashif, Kashif Rashid
Paperback | Engels
€ 62,45
+ 124 punten
Omschrijving
Triticale (Triticosecale) a hybrid of wheat (Triticum) and rye (Secale) is an important cereal crop and has more production as compared to wheat. It has gained importance in fulfilling the increased food demands of the world. For a breeding programme genetic variability and the genetic relationship among genotypes is important. To study this, 70 lines of triticale introduced from CIMMYT were planted in complete block design. Data was recorded for plant height, spike length, number of spikelets per spike, number of grains per spike, number of tillers per meter, grain yields per meter and 1000 grain weight. The data showing significant differences was subjected correlation and cluster analysis. Correlation analysis gave the results that plant height had negative and non-significant correlation with grain yield per meter. It was found that spike length had positive and significant correlation with grain yield per meter. Number of spikelets per spike and grain yield per meter was reported to have positive and significant correlation whereas number of grains per spike had positive and highly significant correlation.
Specificaties
Betrokkenen
- Auteur(s):
- Uitgeverij:
Inhoud
- Aantal bladzijden:
- 108
- Taal:
- Engels
Eigenschappen
- Productcode (EAN):
- 9783846538029
- Verschijningsdatum:
- 10/12/2012
- Uitvoering:
- Paperback
- Afmetingen:
- 150 mm x 220 mm
- Gewicht:
- 168 g

Alleen bij Standaard Boekhandel
+ 124 punten op je klantenkaart van Standaard Boekhandel
Beoordelingen
We publiceren alleen reviews die voldoen aan de voorwaarden voor reviews. Bekijk onze voorwaarden voor reviews.


