- Afhalen na 1 uur in een winkel met voorraad
- Gratis thuislevering in België vanaf € 30
- Ruim aanbod met 7 miljoen producten
- Afhalen na 1 uur in een winkel met voorraad
- Gratis thuislevering in België vanaf € 30
- Ruim aanbod met 7 miljoen producten


€ 102,45
+ 204 punten
Omschrijving
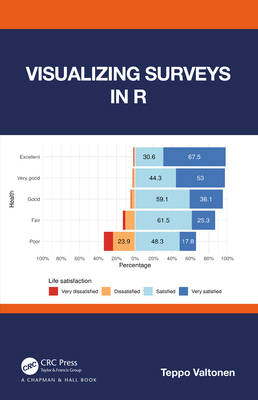
Visualizing Surveys in R is about creating static, print quality figures from survey data using R. The focus is not, for example, on statistical analysis of survey data, but rather on giving concrete solutions for typical problems in visualizing survey data. While there are many excellent books on data visualization, surveys and R, the aim of this book is to bring these topics together, and offer practical instructions for visualizing surveys in R.
Features
- Introduction to survey data: variables, categories, and scales
- Description of a process for visualizing survey data
- Recommendations for reading survey data into R
- Advice on building a survey dataset in R to facilitate versatile plotting
- Step-by-step recipes in R for creating useful plots from survey data
The book is intended for researchers who regularly use surveys and are interested in learning how to seize the vast possibilities and the flexibility of R in survey analysis and visualizations. The book is also valuable for psychologists, marketeers, HR personnel, managers, and other professionals who wish to standardize and automate the process for visualizing survey data. Finally, the book is suitable as a course textbook, either more widely on survey studies, or more strictly on visualizing survey data in R.
Specificaties
Betrokkenen
- Auteur(s):
- Uitgeverij:
Inhoud
- Aantal bladzijden:
- 310
- Taal:
- Engels
Eigenschappen
- Productcode (EAN):
- 9781032246970
- Verschijningsdatum:
- 6/10/2025
- Uitvoering:
- Paperback
- Formaat:
- Trade paperback (VS)
- Afmetingen:
- 156 mm x 234 mm
- Gewicht:
- 458 g


Alleen bij Standaard Boekhandel
+ 204 punten op je klantenkaart van Standaard Boekhandel
Cadeau

AANGERADEN


Beoordelingen
We publiceren alleen reviews die voldoen aan de voorwaarden voor reviews. Bekijk onze voorwaarden voor reviews.