Bedankt voor het vertrouwen het afgelopen jaar! Om jou te bedanken bieden we GRATIS verzending (in België) aan op alles gedurende de hele maand januari.
- Afhalen na 1 uur in een winkel met voorraad
- In januari gratis thuislevering in België
- Ruim aanbod met 7 miljoen producten
Bedankt voor het vertrouwen het afgelopen jaar! Om jou te bedanken bieden we GRATIS verzending (in België) aan op alles gedurende de hele maand januari.
- Afhalen na 1 uur in een winkel met voorraad
- In januari gratis thuislevering in België
- Ruim aanbod met 7 miljoen producten
Zoeken
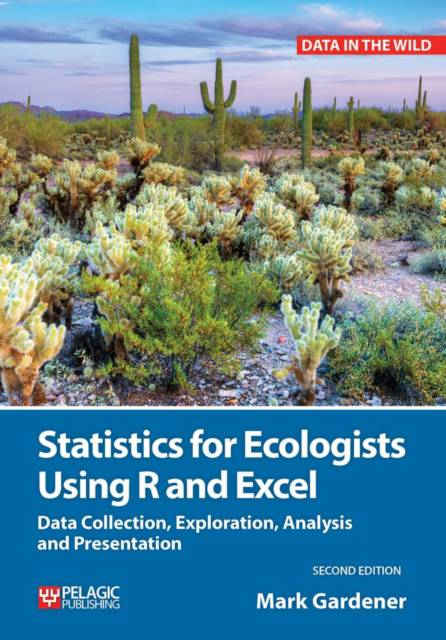
Statistics for Ecologists Using R and Excel
Data Collection, Exploration, Analysis and Presentation
Mark Gardener
€ 72,95
+ 145 punten
Omschrijving
This is a book about the scientific process and how you apply it to data in ecology. You will learn how to plan for data collection, how to assemble data, how to analyze data and finally how to present the results. The book uses Microsoft Excel and the powerful Open Source R program to carry out data handling as well as producing graphs. Statistical approaches covered include: data exploration; tests for difference - t-test and U-test; correlation - Spearman's rank test and Pearson product-moment; association including Chi-squared tests and goodness of fit; multivariate testing using analysis of variance (ANOVA) and Kruskal-Wallis test; and multiple regression. Key skills taught in this book include: how to plan ecological projects; how to record and assemble your data; how to use R and Excel for data analysis and graphs; how to carry out a wide range of statistical analyses including analysis of variance and regression; how to create professional looking graphs; and how to present your results. New in this edition: a completely revised chapter on graphics including graph types and their uses, Excel Chart Tools, R graphics commands and producing different chart types in Excel and in R; an expanded range of support material online, including; example data, exercises and additional notes & explanations; a new chapter on basic community statistics, biodiversity and similarity; chapter summaries and end-of-chapter exercises. Praise for the first edition: A must for anyone getting to grips with data analysis using R and excel. - Amazon 5-star review It has been very easy to follow and will be perfect for anyone. - Amazon 5-star review A solid introduction to working with Excel and R. The writing is clear and informative, the book provides plenty of examples and figures so that each string of code in R or step in Excel is understood by the reader. - Goodreads, 4-star review
Specificaties
Betrokkenen
- Auteur(s):
- Uitgeverij:
Inhoud
- Aantal bladzijden:
- 352
- Taal:
- Engels
- Reeks:
Eigenschappen
- Productcode (EAN):
- 9781784271398
- Verschijningsdatum:
- 7/03/2017
- Uitvoering:
- Paperback
- Formaat:
- Trade paperback (VS)
- Afmetingen:
- 170 mm x 241 mm
- Gewicht:
- 861 g

Alleen bij Standaard Boekhandel
+ 145 punten op je klantenkaart van Standaard Boekhandel
Beoordelingen
We publiceren alleen reviews die voldoen aan de voorwaarden voor reviews. Bekijk onze voorwaarden voor reviews.


