- Afhalen na 1 uur in een winkel met voorraad
- Gratis thuislevering in België vanaf € 30
- Ruim aanbod met 7 miljoen producten
- Afhalen na 1 uur in een winkel met voorraad
- Gratis thuislevering in België vanaf € 30
- Ruim aanbod met 7 miljoen producten


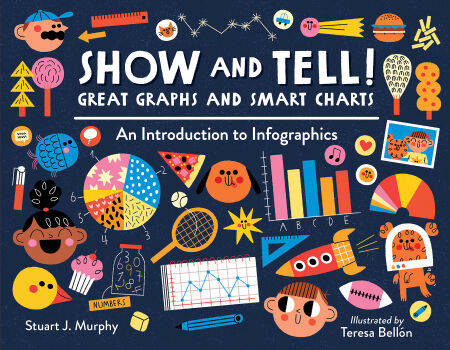
Show and Tell! Great Graphs and Smart Charts E-BOOK
An Introduction to Infographics
Stuart J. Murphy
E-book | Engels
€ 8,86
+ 8 punten
Uitvoering
Omschrijving
A visual-learning expert races up the charts and graphs math success with kid-friendly content sure to help with homework.
Want to find the most popular meal in the cafeteria? Compare town sports enrollments? Or maybe you just want to know who burps the most in your family! Learn what line graphs, bar graphs, pie charts, and pictographs are and how and when to use them to represent data.
Each project shows how to build a chart or graph and ties it all together with a creative infographic that really puts the A in STEAM (Science, Technology, Engineering, ARTS, and Mathematics). Whether used as an introductory aid or to underscore previous knowledge, the book prepares today's visually savvy children to succeed in school and life by analyzing the world around them.
Specificaties
Betrokkenen
- Auteur(s):
- Illustrator(s):
- Uitgeverij:
Inhoud
- Aantal bladzijden:
- 48
- Taal:
- Engels
Eigenschappen
- Productcode (EAN):
- 9781632897114
- Verschijningsdatum:
- 10/10/2022
- Uitvoering:
- E-book
- Beveiligd met:
- Adobe DRM
- Formaat:
- ePub 3 Fixed Layout


Alleen bij Standaard Boekhandel
+ 8 punten op je klantenkaart van Standaard Boekhandel
Cadeau

AANGERADEN


Beoordelingen
We publiceren alleen reviews die voldoen aan de voorwaarden voor reviews. Bekijk onze voorwaarden voor reviews.