Bedankt voor het vertrouwen het afgelopen jaar! Om jou te bedanken bieden we GRATIS verzending (in België) aan op alles gedurende de hele maand januari.
- Afhalen na 1 uur in een winkel met voorraad
- In januari gratis thuislevering in België
- Ruim aanbod met 7 miljoen producten
Bedankt voor het vertrouwen het afgelopen jaar! Om jou te bedanken bieden we GRATIS verzending (in België) aan op alles gedurende de hele maand januari.
- Afhalen na 1 uur in een winkel met voorraad
- In januari gratis thuislevering in België
- Ruim aanbod met 7 miljoen producten
Zoeken
Omschrijving
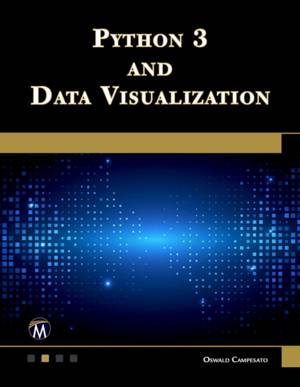
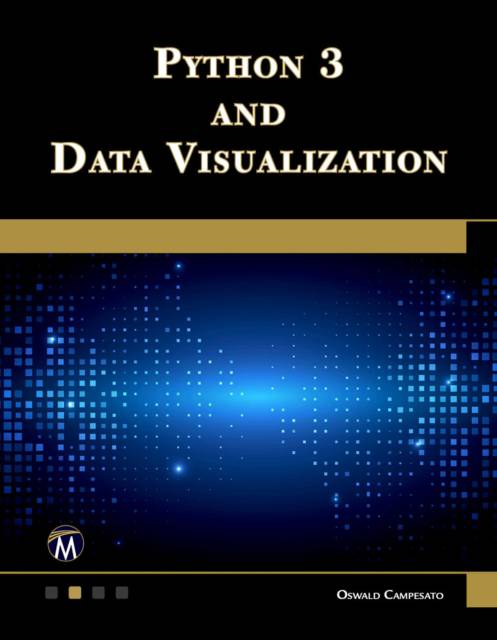
Python3 and Data Visualization offers readers a deep dive into the world of Python 3 programming and the art of data visualization. Chapter 1 introduces the essentials of Python, covering a vast array of topics from basic data types, loops, and functions to more advanced constructs like dictionaries, sets, and matrices. In Chapter 2, the focus shifts to NumPy and its powerful array operations, seamlessly leading into the world of data visualization using prominent libraries such as Matplotlib. Chapter 6 immerses the reader in Seaborn's rich visualization tools, offering insights into datasets like Iris and Titanic. The appendix covers other visualization tools and techniques, including SVG graphics, D3 for dynamic visualizations, and more. The book also includes companion files with numerous Python code samples and figures. From foundational Python concepts to the intricacies of data visualization, this book serves as a comprehensive resource for both beginners and seasoned professionals.
Specificaties
Betrokkenen
- Auteur(s):
- Uitgeverij:
Inhoud
- Aantal bladzijden:
- 280
- Taal:
- Engels
Eigenschappen
- Productcode (EAN):
- 9781683929468
- Verschijningsdatum:
- 26/10/2023
- Uitvoering:
- Paperback
- Formaat:
- Trade paperback (VS)
- Afmetingen:
- 178 mm x 229 mm
- Gewicht:
- 444 g

Alleen bij Standaard Boekhandel
+ 152 punten op je klantenkaart van Standaard Boekhandel
Beoordelingen
We publiceren alleen reviews die voldoen aan de voorwaarden voor reviews. Bekijk onze voorwaarden voor reviews.


