- Afhalen na 1 uur in een winkel met voorraad
- Gratis thuislevering in België vanaf € 30
- Ruim aanbod met 7 miljoen producten
- Afhalen na 1 uur in een winkel met voorraad
- Gratis thuislevering in België vanaf € 30
- Ruim aanbod met 7 miljoen producten
Zoeken
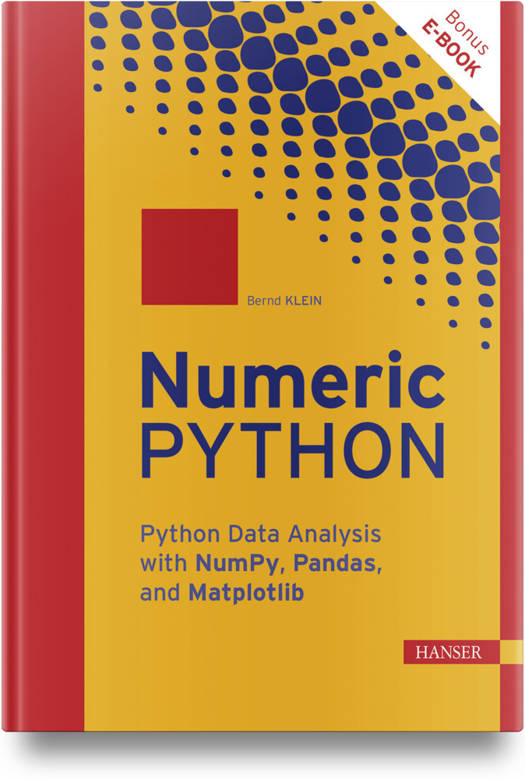
Numeric Python
Python Data Analysis with NumPy, Pandas, and Matplotlib
Bernd Klein
Hardcover | Engels
€ 59,45
+ 118 punten
Omschrijving
- Basics of solving numerical problems with Python- Processing large amounts of data with NumPy, e.g. in machine learning- Data visualization with Matplotlib- Ideal for people in science, engineering and data analysis- Ideal for switching from Matlab to Python- Introduction based on many examples and practical cases as well as sample solutions- Your exclusive advantage: E-Book inside when purchasing the printed bookThis book teaches the Python basics for solving numerical problems in the areas of data science and machine learning.The first part is about NumPy as the basis for numerical programming with Python. Arrays are covered in detail as the central data type for everything, numerical operations, broadcasting and Ufuncs. A separate chapter is devoted to statistics and probability, as well as Boolean masking and file handling.Data visualization with Matplotlib is the focus of the second part. First of all, it's about the terminology of Matplotlib. Line charts, bar charts, histograms and contour plots are covered.The third part is about Pandas with its Series and DataFrames. Dealing with a wide variety of file formats such as Excel, CSV and JSON as well as incomplete data and NaN is also covered. The possibilities of data visualization directly with Pandas are shown.The fourth part offers example applications of the material learned, such as a budget book and a practical income surplus calculation. There is also an introduction to image processing techniques here.Almost each of the 32 chapters contains additional exercises to test and deepen what you have learned; the associated solutions are summarized in the fifth part.FROM THE CONTENT //NumPy:- Numerical operations on multidimensional arrays- Broadcasting and UfuncsMatplotlib:- Discrete and continuous graphs- Bar and column charts, histograms, contour plotsPandas:- Series and DataFrames- Work with Excel, CSV and JSON files- Incomplete data (NaN)- Data visualizationPractical examples:- Image processing- Budget book and income surplus statement
Specificaties
Betrokkenen
- Auteur(s):
- Uitgeverij:
Inhoud
- Aantal bladzijden:
- 450
- Taal:
- Engels
Eigenschappen
- Productcode (EAN):
- 9781569904954
- Verschijningsdatum:
- 15/05/2026
- Uitvoering:
- Hardcover

Alleen bij Standaard Boekhandel
+ 118 punten op je klantenkaart van Standaard Boekhandel
Beoordelingen
We publiceren alleen reviews die voldoen aan de voorwaarden voor reviews. Bekijk onze voorwaarden voor reviews.


