
- Afhalen na 1 uur in een winkel met voorraad
- Gratis thuislevering in België vanaf € 30
- Ruim aanbod met 7 miljoen producten
- Afhalen na 1 uur in een winkel met voorraad
- Gratis thuislevering in België vanaf € 30
- Ruim aanbod met 7 miljoen producten


€ 9,95
+ 19 punten
Uitvoering
Omschrijving
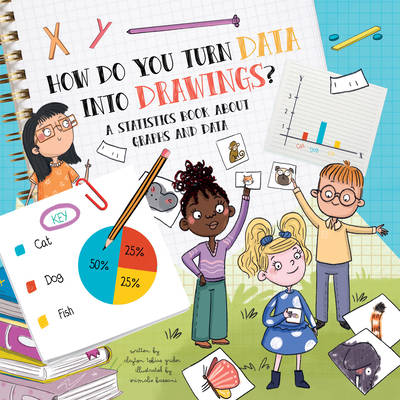
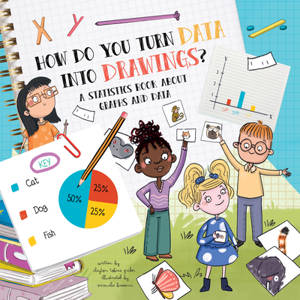
Have you ever wondered how to turn data into graphs and charts? A basic explanation of statistics concepts including descriptive and inferential statistics, collecting and recording data, how to make various graphs, and more is explored through charts, illustrations, and informative text in this new addition to the How Do series. Includes activities in the back of the book.
About the How Do series: These fully-illustrated nonfiction picture books are a great introduction to various STEM topics. Each title includes facts and figures, simple diagrams and hilarious illustrations and is written in a question-and-answer format to encourage readers to ask questions and guess the answers before exploring the science behind the correct answers.Specificaties
Betrokkenen
- Auteur(s):
- Illustrator(s):
- Uitgeverij:
Inhoud
- Aantal bladzijden:
- 32
- Taal:
- Engels
- Reeks:
Eigenschappen
- Productcode (EAN):
- 9781486729852
- Verschijningsdatum:
- 12/03/2024
- Uitvoering:
- Paperback
- Formaat:
- Trade paperback (VS)
- Afmetingen:
- 135 mm x 193 mm
- Gewicht:
- 104 g


Alleen bij Standaard Boekhandel
+ 19 punten op je klantenkaart van Standaard Boekhandel
Cadeau

AANGERADEN


Beoordelingen
We publiceren alleen reviews die voldoen aan de voorwaarden voor reviews. Bekijk onze voorwaarden voor reviews.