
- Afhalen na 1 uur in een winkel met voorraad
- Gratis thuislevering in België vanaf € 30
- Ruim aanbod met 7 miljoen producten
- Afhalen na 1 uur in een winkel met voorraad
- Gratis thuislevering in België vanaf € 30
- Ruim aanbod met 7 miljoen producten


€ 21,45
+ 42 punten
Omschrijving
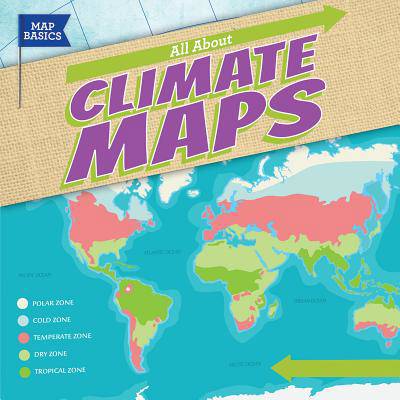
What's the average temperature in Honolulu in July? How much snow should you expect if you visit Minneapolis in January? As students read All About Climate Maps, they'll gain an understanding of the basics of climate and weather and learn how to identify climate zones. Comparing a series of climate maps of the same location in different years will help identify patterns and changes in the weather and precipitation. Interpreting maps of different locations will allow students to compare and contrast the climates. After reading climate maps of a chosen area, students will do an activity to apply what they've learned.
Specificaties
Betrokkenen
- Auteur(s):
- Uitgeverij:
Inhoud
- Aantal bladzijden:
- 24
- Taal:
- Engels
- Reeks:
Eigenschappen
- Productcode (EAN):
- 9781538232606
- Verschijningsdatum:
- 30/12/2018
- Uitvoering:
- Paperback
- Formaat:
- Trade paperback (VS)
- Afmetingen:
- 198 mm x 213 mm
- Gewicht:
- 181 g


Alleen bij Standaard Boekhandel
+ 42 punten op je klantenkaart van Standaard Boekhandel
Cadeau

AANGERADEN


Beoordelingen
We publiceren alleen reviews die voldoen aan de voorwaarden voor reviews. Bekijk onze voorwaarden voor reviews.