Bedankt voor het vertrouwen het afgelopen jaar! Om jou te bedanken bieden we GRATIS verzending (in België) aan op alles gedurende de hele maand januari.
- Afhalen na 1 uur in een winkel met voorraad
- In januari gratis thuislevering in België
- Ruim aanbod met 7 miljoen producten
Bedankt voor het vertrouwen het afgelopen jaar! Om jou te bedanken bieden we GRATIS verzending (in België) aan op alles gedurende de hele maand januari.
- Afhalen na 1 uur in een winkel met voorraad
- In januari gratis thuislevering in België
- Ruim aanbod met 7 miljoen producten
Zoeken
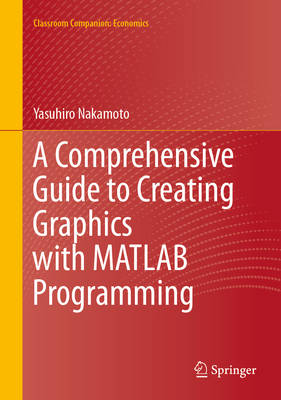
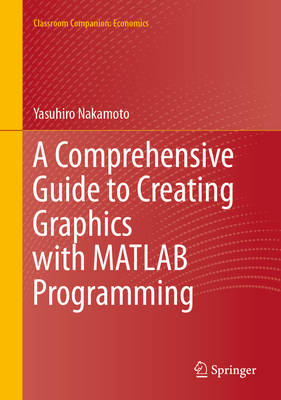
A Comprehensive Guide to Creating Graphics with MATLAB Programming
Yasuhiro Nakamoto
€ 213,95
+ 427 punten
Omschrijving
This textbook teaches you how to use MATLAB to create high-quality graphs using student-friendly statistical data at a level of mathematics accessible to middle or high school students. With more than 500 illustrated examples, this book quickly guides you to the essential information you need to create and customize high-quality graphs without requiring advanced mathematical knowledge. MATLAB gives you complete control over the appearance of each component in your graph. For example, in addition to creating the main graph, such as a scatter plot, line graph, bar graph, or histogram, you can also customize lines, legends, captions, titles, axis labels, gridlines, and many other elements. Whether you use this book for teaching and research or not, you will have the incredible power of MATLAB graphics at your fingertips.
Specificaties
Betrokkenen
- Auteur(s):
- Uitgeverij:
Inhoud
- Aantal bladzijden:
- 580
- Taal:
- Engels
- Reeks:
Eigenschappen
- Productcode (EAN):
- 9789819662128
- Verschijningsdatum:
- 31/10/2025
- Uitvoering:
- Hardcover
- Formaat:
- Genaaid
- Afmetingen:
- 170 mm x 244 mm
- Gewicht:
- 1161 g

Alleen bij Standaard Boekhandel
+ 427 punten op je klantenkaart van Standaard Boekhandel
Beoordelingen
We publiceren alleen reviews die voldoen aan de voorwaarden voor reviews. Bekijk onze voorwaarden voor reviews.


